Watch out for nutrient removal changes
In 2019, if you grew vetch hay, cut crops for hay instead of grain, or harvested straw as well as grain, you changed the balance of nutrients exported from your paddocks.
Click here to download this article
To help understand what this means for your 2020 nutrient budgets, we have analysed grain and leaf tissue data collected from crops in the Mallee and Riverine Plains.
The grain and leaf samples were collected in 2019 from vetch, oaten hay, barley hay, wheat hay, barley straw, wheat straw, barley grain, wheat grain and faba bean crops. Samples were taken from areas of known and stable yields to allow nutrient removal to be calculated. Testing was conducted by the Nutrient Advantage® laboratory.
While the nutrient removal data varied between and within crops, it highlighted six key messages:
- expect significant nutrient removal from vetch
- phosphorus removal from wheat grain varies
- hay removes more potassium than grain
- copper may be needed
- keep up zinc replacement strategies
- cutting straw increases total nutrient removal.
1. Expect significant nutrient removal from vetch
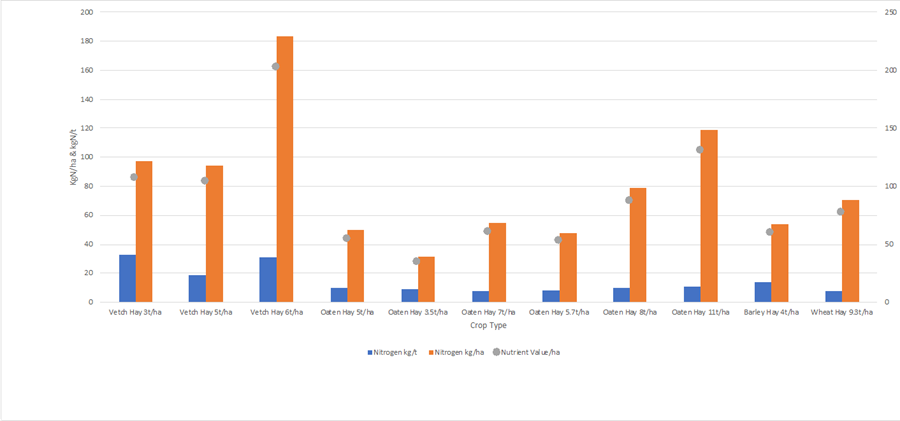
Vetch hay may provide additional nitrogen to the soil if inoculated, but it produces a high protein hay, so it will also remove significant amounts of nitrogen. The three vetch hay crops tested this summer removed between 19 and 32 kg of nitrogen per tonne of hay. In one crop, which yielded 6 t/ha of drymatter, that amounted to more than 180 kg/ha of nitrogen. See Figure 1.
2. Phosphorus removal from wheat grain varies
Wheat growers who use a phosphorus replacement strategy for wheat, based on just a ‘rule of thumb’ removal rate, are at risk of over- or under-estimating their phosphorus requirements by a fair margin, because the variation in removal is quite high.
The phosphorus removal from the nine wheat grain samples ranged from 2.3 to 4 kg of phosphorus per tonne of grain. Depending on the yield, the overall phosphorus removal per hectare was between 6 and 13 kg/ha. See Figure 2. Given the large variation, growers should test grains each year after harvest from areas with a known yield to refine their nutrient budgeting based on actual phosphorus removal.
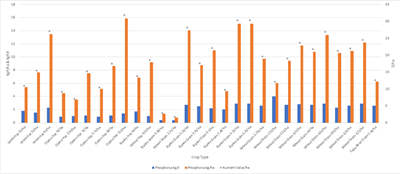
Note: Nutrient value calculated based on replacing the phosphorus with DAP at $600/t.
3. Hay removes more potassium than grain
Potassium resides in the leaves and stems of plants, so it is no surprise that hay and straw remove more potassium per tonne than grain. In the crops tested, around three times as much potassium was removed from a tonne of wheat hay than was taken from a tonne of grain. As hay yields are often high, this can add up to significant amounts of potassium removed. See Figure 3. If wheat or barley straw is baled after harvest, potassium removal can easily double. Barley and wheat straw each tested at over 10 kg of potassium per tonne, while grain was in the range of 3.7 to 5 kg of potassium per tonne. Dedicated hay crops like vetch and oaten hay also removed significant amounts of potassium.
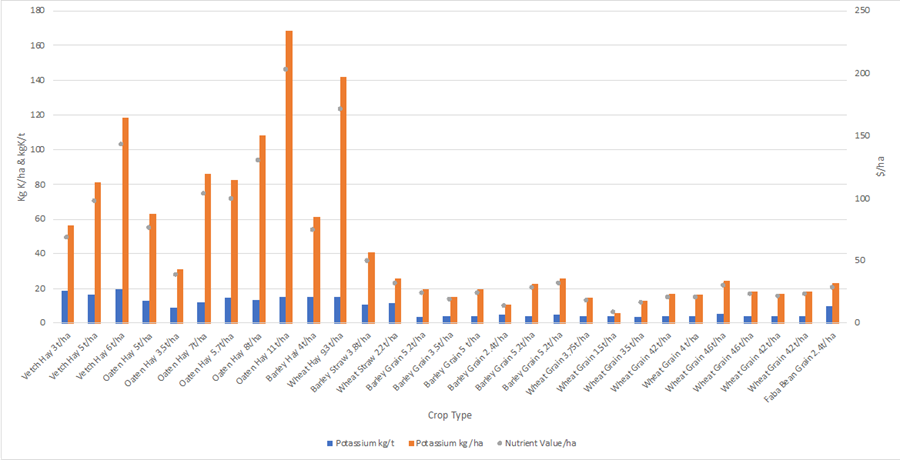
Note: Nutrient value calculated based on replacing the potassium with MOP at $600/t.
Frequent hay production, particularly on sandy soil types, will reduce soil potassium reserves. Consider leaf tissue testing for potassium during crop growth or soil testing for potassium both at the soil surface and to depth.
4. Copper may be needed
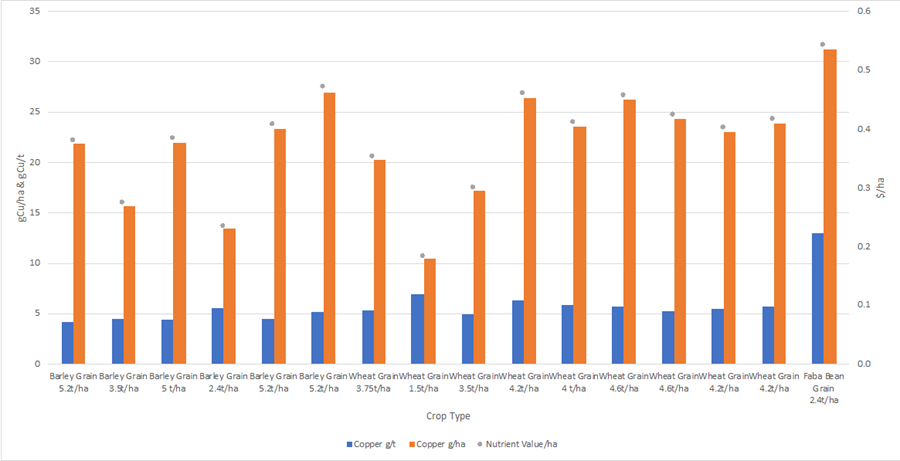
Based on the samples collected this summer, 20 to 30 grams/ha of copper was removed from the wheat and barley grain crops. See Figure 4. Without replacement, this level of removal will deplete soil reserves. Copper is a micronutrient, so the best way to monitor fertility levels is to apply copper fertiliser in test strips and check for responses in crop.
5. Keep up zinc replacement strategies
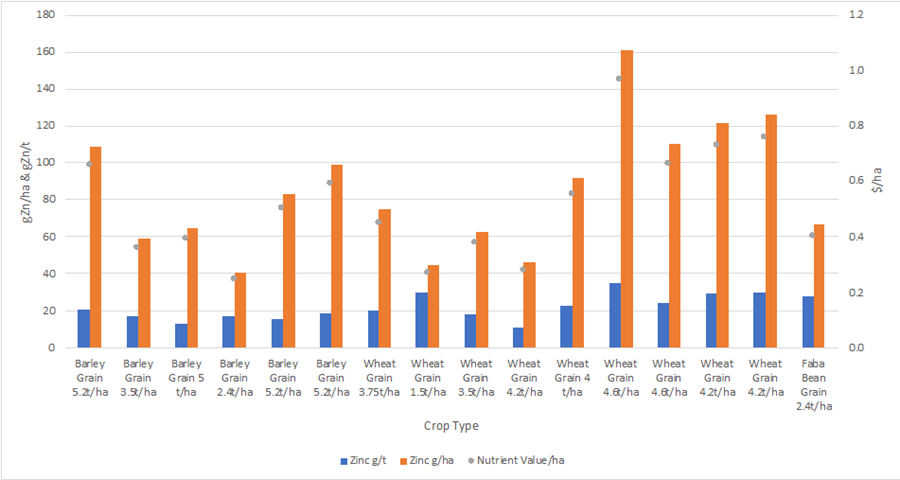
More zinc is removed in grain than from hay. The variation in removal between grain crops is quite significant. The highest removal rate from a wheat crop was 35 grams of zinc per tonne of grain, which equated to more than 100 grams of zinc per hectare. See Figure 5. This result demonstrates you need an annual zinc replacement strategy using a fertiliser like Granulock® Z in your starter fertiliser program.
6. Cutting straw increases total nutrient removal
Cutting and removing straw after the grain harvest will add to the total nutrient removal, particularly for potassium, but also for nitrogen and zinc. See Figure 6. This will need to be taken into account when planning fertiliser replacement strategies.

In summary
Cutting wheat for hay instead of grain, changing the rotation to add in a vetch crop or baling the straw as well as harvesting the grain are all decisions which will affect the balance of nutrients removed from the paddock. Grain and tissue tests from Nutrient Advantage are simple to arrange and allow growers and advisers to accurately track the nutrients leaving the paddock. At around $50 per test, grain and tissue testing is well worth considering.
To discuss any aspect of this analysis or find out more about grain and tissue testing, please contact me on lee.menhenett@incitecpivot.com.au or 0412 565 176.


