Topdressing trials and tribulations
Topdressing nitrogen can be difficult to get right with respect to timing and rate. Given that nitrogen is the biggest barrier to yield (except for moisture), it requires careful planning and management.

by Lee Menhenett - Technical Agronomist
Download this article
The basic fundamentals for nitrogen rate applications are:
- Stored soil moisture
- Crop rotation
- Organic carbon
- Seasonal outlook
- Paddock disease/weeds status
- Residual soil nitrogen post-harvest
This season in the Mallee, crops have generally had excellent soil moisture levels, but poor residual nitrogen levels (<20 kg/ha) from 2016. Although there has been an increase in legumes, organic carbon levels are still poor. Weeds and diseases will need to be assessed on a paddock by paddock basis.
As for the season, while it has been an average or below average winter so far, the outlook for spring is average to slightly drier.
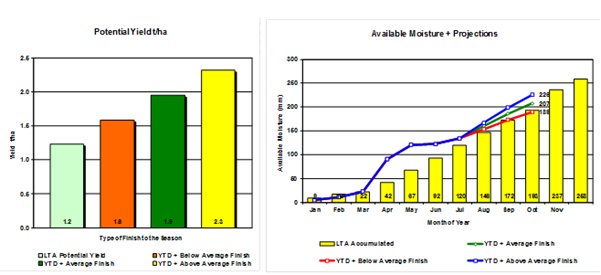
Water Limited Yield (WLY) dictates the total amount of nitrogen which should be applied to a crop.
Stored moisture, in crop rainfall and post topdress seasonal rainfall scenarios are used to build a Water Limited Yield (Table 2).
The yield component of nitrogen budgeting is a flexible estimate, however bear in mind that in our nitrogen trials economic outcomes are often better when applying higher nitrogen rates than the optimum, rather than lower nitrogen rates. See financial tables.
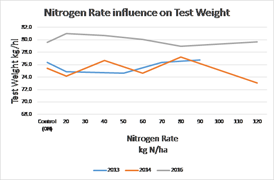
The component to fix in budgeting for cereals is protein. Referred to as the critical protein percentage, it is the point at which grain yield is maximised.
By achieving a lower protein percentage in grain, it is reasonable to conclude that the crop ran out of nitrogen before it ran out of moisture.
Environmental and varietal factors can influence this rule, however for nitrogen budgeting purposes it is a solid platform.
The graphs below show that maximum yield is produced with protein values around 11%. While this protein percentage can vary to be slightly higher or slightly lower, as a broad indicator, setting APW as a grain delivery standard is a good way to achieve close to maximum yield.
Dry hotter seasonal finishes may see smaller, higher protein grains while a cooler, wetter finish may see larger grain sizes with higher yields and lower protein.
Setting a critical protein value allows yield to flex in different seasons.
Water Limited Yield = (Stored Moisture* + Growing Season Rain) – 110 mm non-productive moisture
*30% of effective (i.e. >20mm) summer rainfall events
Nitrogen crop budgets
N Requirement = Yield x Protein x Protein factor x Efficiency
Table 1: Guide to nitrogen budgeting in the Mallee
|
|
Wheat |
Barley |
Canola |
|
Protein % |
11-11.5 |
10.5 |
18-24%* |
|
Protein factor |
1.75 |
1.6 |
1.6 |
|
Efficiency |
40-45% (2.5-2.22) |
45-50% (2.22-2) |
33% (3) |
For example, if a growers was targeting a 3 t/ha wheat crop, the equation to determine the nitrogen requirement would be: 3 x 11 x 1.75 x 2.5 = 144 kg/ha of nitrogen.
Then it would be necessary to deduct any soil mineral nitrogen to rooting depth and any in crop mineralisation.
The relationship between grain yield and protein
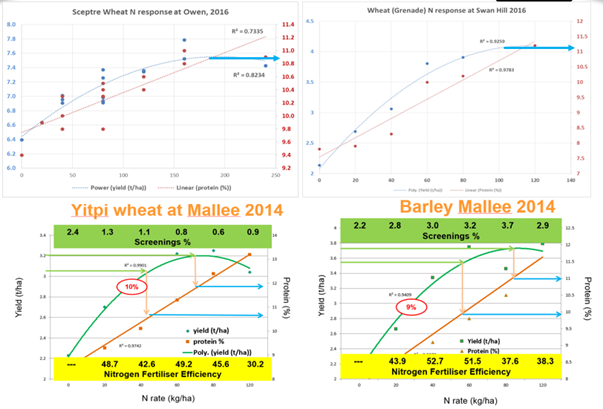
Table 2 – Water limited yield predictions and associated nitrogen requirements for wheat at Swan Hill
|
|
Jan |
Feb |
Mar |
Apr |
May |
Jun |
Jul |
Aug |
Sep |
Oct |
Nov |
Dec |
Growing season rainfall |
Water limited yield prediction |
|
Long term average (LTA) |
27 |
22 |
17 |
20 |
25 |
26 |
28 |
26 |
26 |
22 |
43 |
21 |
172 |
|
|
LTA accumulated |
9 |
16 |
22 |
42 |
67 |
92 |
120 |
146 |
172 |
193 |
237 |
258 |
|
1.2 t/ha |
|
Actual monthly rainfall |
13 |
20 |
34 |
68 |
30 |
2 |
12 |
0 |
0 |
0 |
|
|
111.8 |
|
|
Available moisture |
4 |
7 |
11 |
90 |
120 |
122 |
134 |
134 |
134 |
134 |
|
|
|
|
|
YTD + below average finish |
4 |
7 |
11 |
68 |
30 |
2 |
12 |
19 |
20 |
16 |
|
|
189 |
1.6 t/ha |
|
YTD + average finish |
4 |
7 |
11 |
68 |
30 |
2 |
12 |
26 |
26 |
22 |
|
|
207 |
1.9 t/ha |
|
YTD = above average finish |
4 |
7 |
11 |
68 |
30 |
2 |
12 |
32 |
33 |
27 |
|
|
226 |
2.3 t/ha |
Timing of nitrogen applications
Infrequent rain fronts and unreliable rain forecasts make effective nitrogen topdress decisions very difficult in the Mallee.
On average,there are fewer than six effective topdress rainfall events in the Mallee growing season and if those events close to sowing or from mid August are removed, then the odds of having a successful nitrogen application decrease significantly.
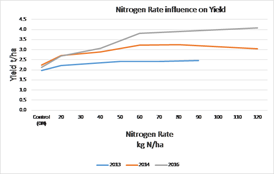
Our trial work has shown the timing of nitrogen applications is not nessassarily critical – it is more about rate.
Although there’s been an increase in legume rotations in recent years, mineral soil nitrogen and organic carbon levels in the Mallee are typically low, so the risk of applying nitrogen early and creating excessive plant growth leading to haying off is minimal.
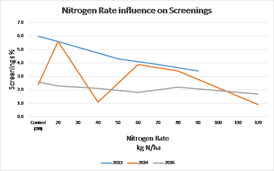
In 2014, rates of up to 120 kg/ha of nitrogen were banded at sowing in a trial at Beauchamp and actually had a positive effect on screenings, however yield was declining and protein was significantly higher.
Leaving nitrogen applications too late can negatively impact on yield, as seen in trials from 2013, 2014 and 2016 where 40 kg/ha of nitrogen (46 kg/ha in 2013) topdressed at GS31 decreased yields by 0.28 t/ha, 0.18 t/ha (ns) and 0.67 t/ha respectively compared with 40 kg/ha of nitrogen (46 kg/ha in 2013) banded at sowing.
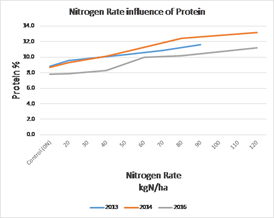
Reduced tillering (head/m2) and/or the loss of tillers and a decrease in viable spiklets due to nitrogen stress would most likely be the cause of the yield reductions. There was no difference in grain protein in any year.
Comparing these later nitrogen applications to the control in the three trial years shows an 0.48 t/ha increase in yield in 2014, but that it did not have a positive yield effect in 2013 where the yield increase was 0.16 t/ha (ns) or 2016 with 0.26 t/ha (ns). Grain protein increased by 1.3% in 2013 and 0.9% in 2016 and there was no protein influence in 2014.
Influence of nitrogen rate in recent Mallee trials
So how late can nitrogen be topdressed in the Mallee environment?
Generally, there is no willingness to apply nitrogen after early to mid August.
At this time, crops are generally from GS31 to 39, or an early sown crop could be as advanded as GS45, so the yield penalties as described above have already occurred if no nitrogen has been applied.
If some nitrogen fertiliser (20-40 kg/ha of nitrogen) has been applied prior to GS31, then it is still possible to influence yield if there is good stored moisture and a reasonable rainfall event to take the nitrogen into the soil and maintain plant root activity in the top 30 cm.
Haying off and subsequent high screenings are generally associated with large amounts of nitrogen during the early vegetative stage of crops, causing excessive tillering and biomass production.
It could be argued that at the lower sowing rates and the use of short season wheat varieties with lower tiller numbers in the Mallee environment decreases this risk.
The risk is also lowered due to the region’s very low mineralisation potential, low soil mineral nitrogen this season and the fact that early nitrogen applications, such as at sowing or early tillering, provide parity yields with splits in our trials.
Applying nitrogen from GS31 to 45 should not cause an increase in screenings. If there happens to be minimal or no rainfall until crop maturity, the majority of that applied nitrogen would still reside in the soil for the subsequent crop.
As a general rule for the Mallee, 40 kg/ha of nitrogen is the base rate for below average seasons, 40-60 kg/ha of nitrogen for average seasons and 60-80 kg/ha of nitrogen for above average seasons.
The financial tables shown below highlight this point and also indicate that applying above the optimum financial yield is often better than under applying nitrogen.
The risk is not getting enough nitrogen on the crop, rather than over applying.
The tables below summarise the trial data from 2013, 2014 and 2016, including $/ha return net of fertiliser cost.
Yield and estimated net returns in wheat at Beauchamp in 2013
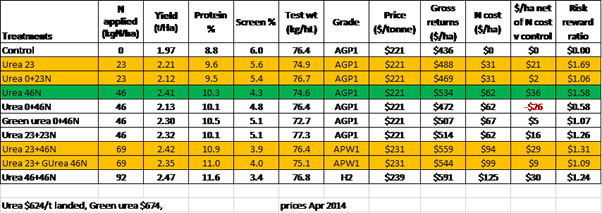
Yield and estimated net returns in wheat at Beauchamp in 2014
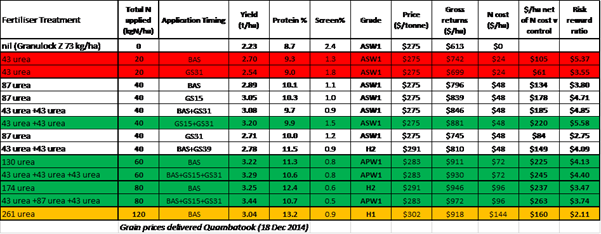
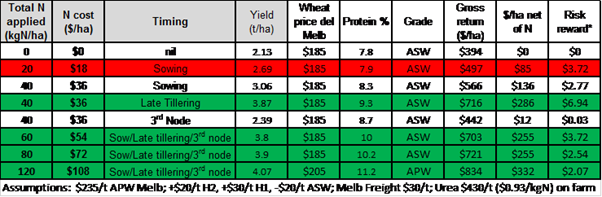
Yield and estimated net returns in wheat at Nyah West in 2016
Using a basic water use efficiency (WUE) calculation for each trial year shows the value in managing nitrogen rate with respect to utilising moisture.
Water Use Efficiency in wheat, 2013, Stored 5 mm, GSR 221 mm
|
N applied (kg/ha) |
Yield (t/ha) |
kg grain/mm |
|
0 |
1.97 |
16.9 |
|
23 |
2.21 |
19 |
|
46 |
2.41 |
20.7 |
|
69 |
2.42 |
20.8 |
|
92 |
2.47 |
21.2 |
Water Use Efficiency in wheat, 2014, Stored 20 mm, GSR 214 mm
|
N applied (kg/ha) |
Yield (t/ha) |
kg grain/mm |
|
0 |
2.23 |
17.9 |
|
20 |
2.7 |
21.7 |
|
40 |
2.89 |
23.3 |
|
60 |
3.22 |
25.9 |
|
120 |
3.04 |
24.5 |
Water Use Efficiency in wheat, 2016, Stored 24 mm, GSR 272 mm
|
N applied (kg/ha) |
Yield (t/ha) |
kg grain/mm |
|
0 |
2.13 |
11.4 |
|
20 |
2.69 |
14.3 |
|
40 |
3.06 |
16.3 |
|
60 |
3.81 |
20.3 |
|
80 |
3.91 |
20.8 |
|
120 |
4.07 |
21.7 |
Note: Non Productive Moisture 110 mm, GSR April-Sept, Stored 30% summer rainfall.
Nitrogen is a key driver in maximising yield from moisture, leading to greater on farm returns.
The difficulty is the unpredictability of seasonal conditions.
Using a planned approach in adjusting yield based on moisture and seasonal outlook, setting protein targets and not being overly conservative with nitrogen rates will generally lead to favourable outcomes.
For more information, feel free to contact me on 0417 896 377 or lee.menhenett@incitecpivot.com.au.